
The Modality Effect
Human cognitive architecture contains separate processors for handling visual information, such as diagrams (the visuo-spatial sketchpad), and auditory information, such as verbal commentary (the phonological loop). Information coming from these two sources is coordinated within a central executive (Baddleley, 1992).
By splitting the information presented to learners into a format so that some information is presented in visual form, and other information is presented in audio form, working memory capacity can be expanded and learning increased.
Note that the information presented visually and that presented in auditory form is not duplicate information, but supplement each other. The audio typically explains features of a presented graphic or is an accompaniment, explaining features in an animation or video.
Guiding attention to specific visual aspects using techniques such as highlighting, arrows or some form of animation, synchronised with the audio presentation, may greatly facilitate learners’ processing and integration of the two information streams.
Partitioning to-be-learned content so that some information, such as graphics, is presented visually, while other information, such as text, is presented auditorily, enhances learning (see Mousavi, Low and Sweller, 1995; Jeung, Chandler and Sweller, 1997; Tindall-Ford, Chandler and Sweller, 1997).
Information should be broken into discrete elements, some of which are naturally presented in a visual format such as a drawing, table, chart, or schematic diagram. Explanatory information is presented as an accompanying audio, rather than as a text based presentation.
The audio information must be presented in a cognitively cohesive form with the visual information. Consequently, these need to be presented simultaneously. Cues such as highlighting or flashing are often used to draw learner’s attention to the relationship between the visual information and the audio information.
Note that the information in audio format is not presented additionally as text before, during, or after, the audio presentation.
Complex information should be analysed and evaluated regarding suitability for visual and auditory presentations.
Whenever it is determined that information can be distributed across the modalities in a manner that reduces the risk of cognitive overload by learners, such instructional design options should be sought.
Public presentations of graphics such as diagrams or charts, with accompanying spoken dialogue explaining them, may be delivered live in classrooms or on-line delivery. Animations and videos with embedded narration may be delivered from stored media such as DVDs. Interactive simulations with dynamically responsive graphical elements and synchronised audio accompaniment may be produced as a computer application.
Each of these media decisions will have implications to finance, time and effort to develop. This needs to be weighed against the potential benefits to learners, especially those learners who have previously demonstrated difficulties in learning such information through more conventional instructional and educational materials.
Jeung, Chandler and Sweller (1997) investigated different instructional formats for worked examples addressing corresponding angles in geometry.
When presenting worked examples for geometry, there is a necessity to present a geometrical diagram.
But what about the information explaining the diagram? Such information can be presented either visually as text, or as audio. Moreover, such information needs to be mentally integrated with the relevant visual elements within the geometrical structure.
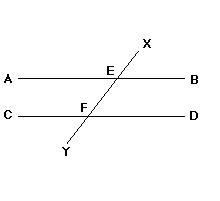
The information that was presented with this geometrical diagram was as follows:
When two parallel lines intersect with a third line, four pairs of corresponding angles are equal.
In the diagram, two parallel lines, AB and CD, intersect with a third line, XY.
The following four pairs of angles are corresponding angles:
Angle AEX = Angle CFE
Angle AEF = Angle CFY
Angle XEB = Angle EFD
Angle FEB = Angle YFD
This study also investigated the usefulness of visual flashing highlights that were coordinated to identify the angles on the diagram as they were announced by the audio.
The study found that for complex geometrical diagrams such as the one shown, synchronised screen highlighting was essential to produce an effective instructional presentation. Without such highlighting, the audio presentation was no more effective than a text based presentation of the information.
For geometrical diagrams that were very simple, such highlighting was not needed to enable students to identify and integrate the audio information, but in this context this was also no more effective than text based presentations.
Many educational and training situations need to present information regarding diagrams, charts and tables.
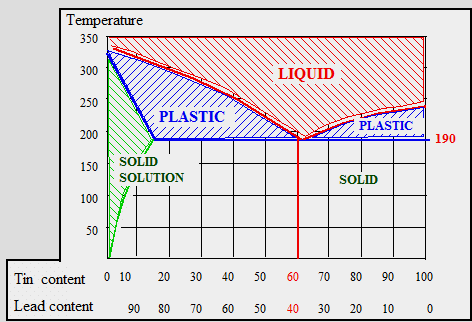
This diagram demonstrating properties of Eutectic Solder is one such situation. The diagram presents information about the melting points of different mixes of tin and lead. Depending on the ratio, the temperature band in which the solder remains "plastic" varies substantially. Ideally, solder should transition from totally liquid to totally solid as quickly as possible, and this is "eutectic solder".
Information about the diagram may be presented in either text based form on screen, as an audio accompaniment, or both. The information accompanying this graphic is:
"When heated the, the 60/40 solder becomes totally liquid at lower temperatures than most other
solder ratios, approximately 190 degrees Celsius."
Kalyuga, Chandler and Sweller (1999) investigated different modalities for presenting such information in association with the graphic. It was demonstrated that the best form of presenting the information was by using audio with the graphic, but only if the text was omitted from the screen. The second best way of presenting was to have the text on screen with the graphic. The least successful way of presenting was to have both the text and the audio presented with the diagram.
On many levels, this is counter intuitive, after all it may be argued that a combined text and audio presentation of information, along with the graphic, caters for learners with different "learning styles", and the dual presentation of visual information plus audio information should be "reinforcing".
However, from a cognitive load analysis, it can be determined that the audio and the text based information are duplicates of one another. As such they are redundant and one should be omitted.
In this case it is the text that should be removed. By presented the graphical information of the diagram in conjunction with the verbal based information through audio, working memory processing capacity is effectively expanded. Learners may focus their visual attention of the graphic and the phonological attention on the audio.
Many educational and training situations need to present information regarding dynamical systems and processes.
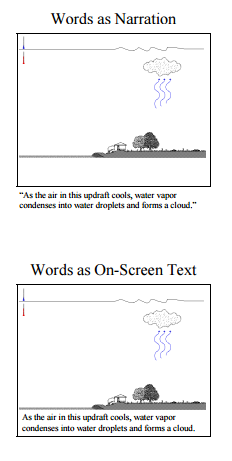
These two diagrams represent two different ways to present information about the dynamical process giving rise to cloud formation. They lead to a sequence of similar materials to explain the processes behind storms, hail and lightning strikes.
They present identical basic schematic diagrams, identical graphical features to suggest movement and identical accompanying information to explain the process.
The two formats differ. The top image is indicating that the accompanying information is presented by audio only. The lower image is indicating that the accompanying information is presented by text only.
In a wide range of ongoing experiments investigating the dynamics of storms, lightning, bike pumps and car braking systems, Richard Mayer and his colleagues have been investigating and elucidating the underlying principles of effective and efficient multimedia based learning.
It has been demonstrated across many contexts that when presenting information about dynamical systems, the optimum presentation involves basic schematic diagrams to indicate the objects under consideration, simple graphical indicators of animation to demonstrate a dynamic principles in operation and an organised, synchronised audio accompaniment to explain the information embedded within the presentation.
It is also becoming increasingly clear that, in such situations, the inclusion of a textual version of the audio, essentially a "transcript", is best removed from the presentation.
There will be times and places where text is essential to support learners who may be hearing impaired, but the ideal model is to present information that is supporting both static and animated graphics is through audio...alone.
There are also various content domains which warrant textual based presentations over audio. The stand outs on this are mathematically based and other similarly technical orientated domains such as chemistry, physics, electronics, engineering and programming. The specific tasks where hard copy is preferable, however, is within the context of working through problem solving transformations.
When the primary goal is for learners to acquire conceptual information, multimedia based presentations of audio accompanying graphics, with textual versions omitted, are preferable.
Baddeley, A. (1992). Working Memory. Science, 255, 556–559.
Clark, R., C., & Mayer, R., E. (2016). e-Learning and the Science of Instruction. John Wiley & Sons, United States of America.
Jeung, H., Chandler, P., & Sweller, J. (1997). The role of visual indicators in dual sensory mode instruction. Educational Psychology, 17, 329-343.
Kalyuga, S., Chandler, P., & Sweller, J. ( 1999). Managing split-attention and redundancy in multimedia instruction. Applied Cognitive Psychology, 13, 351-372.
Marcus, N., Cooper, M., & Sweller, J. (1996). Understanding instructions. Journal of Educational Psychology, 88(1), 49–63. http://doi.org/10.1037/0022-0663.88.1.49
Mayer, R. E., & Moreno, R. (1998). A Cognitive Theory of Multimedia Learning: Implications for Design Principles. Retrieved from http://www.unm.edu/~moreno/PDFS/chi.pdf
Mousavi, S. Y., Low, R., & Sweller, J. (1995). Reducing cognitive load by mixing auditory and visual presentation modes. Journal of Educational Psychology, 87, 319–334. http://doi.org/10.1037/0022-0663.87.2.319
Tindall-Ford, S., Chandler, P., & Sweller, J. (1997). When two sensory modes are better than one. Journal of Experimental Psychology: Applied, 3(4), 257–287. http://doi.org/10.1037/1076-898X.3.4.257